TL;DR: General purpose compression algorithms are pretty good. Can we beat them with a low effort optimization in compressing ETL files? Even if we could, it doesn’t mean we should.
Event Tracing for Windows is outright amazing. If you are a developer on Windows (native, managed, or even web) and have never used or (God forbid) heard of it, I can tell you that you are missing out on a very useful technology. I’m not an industry veteran nor an ETW specialist, but I already solved many incredibly complex customer issues using it (and its GUI analyzer, called the “Windows Performance Analyzer”) throughout my career. If you are not familiar with ETW, I suggest you start reading some of Bruce Dawson’s blog posts about investigations he made using it.
Anyways, this blog post will not be about ETW in general, but its binary output files of extension “.etl”. If you’ve ever taken a trace with the Windows Performace Recorder (or xperf), you know that these files can end up being pretty huge. Run system-wide tracing with sampled profiling and context switch recording for a few minutes, and we are already talking about gigabytes. Let’s see if we can beat general purpose compression algorithms using semantic knowledge about the content of ETL files.
Built-in compression
Built-in compression for ETL traces was introduced in Windows 8. xperf and some other tools can output compressed traces, which still have the “.etl” extension and can still be opened and handled by all the tools, just like their regular, uncompressed counterparts. This whole topic is lightly documented; it gets a mention in a few places, but nothing more.
What algorithm is used and how efficient is it? I poked around in xperf and WPA to find out. For compression, data gets fed to RtlCompressBuffer in smaller chunks, selecting the COMPRESSION_FORMAT_LZNT1 algorithm. For decompression, RtlDecompressBufferEx is used. LZNT1 is based on the original LZ77 algorithm.
The LZ77 algorithm:
- is one of the faster compression/decompression algorithms
- is easy to implement
- offers reasonable compression ratios
I am certainly no expert in compression algorithms, but even after some admittedly shallow reading on Wikipedia, it’s clear that there are newer algorithms out there which provide better compression ratios without needing much more memory and computational power. Why didn’t Microsoft choose something “better”? Maybe they didn’t want to introduce another algorithm into the whole NT ecosystem, or maybe they thought compression speed is the most important factor1.
Let’s see how LZNT1 performs. I prepared three test files for my experiments: one large, one medium, and one small ETL file. The medium size file is a usual ETL file created with the Windows Performance Recorder (with the “First Triage”, “Disk IO”, and “File IO” options selected). The other two are a different story. The ETW session where they were recorded from had the “kernel provider” enabled only, namely: sampled profiles (with call stacks), context switches (with call stacks), and other boilerplate necessary for WPA to be able to handle the trace and display call stacks correctly (module loads, thread and process creation, etc.). These two were also filtered, so events for one process of interest were preserved only. The reason for this is nothing special, I just needed better compression of this particular kind of traces2, that’s why I started looking for alternatives for compression in the first place. Just for the sake of this blog post I also wanted to see the numbers for a “normal” ETW trace, so I threw one into the mix (the medium size trace) as well. Throughout this post you’ll see the letter “f” attached whenever I refer to the smallf and largef traces, just to remind you that these are not regular, but filtered ETL files.
The traces don’t just differ in their sizes, but also in the kind and amount of CPU load. The largef file was captured when I played a video game called World of Tanks actively for ~30 minutes. The smallf one was created when I listened to music with Spotify for about 6 minutes. The medium size file was captured when various programs ran on my computer; the CPU load was about 15% on average, and recording ran for about 2 minutes.
WPA has a Trace Statistics view which shows you statistics about the number of events a trace contains, and their (uncompressed) sizes. This is great, because with this we can find out which types of events contribute to our trace sizes the most. Here’s an image with statistics for all three traces:
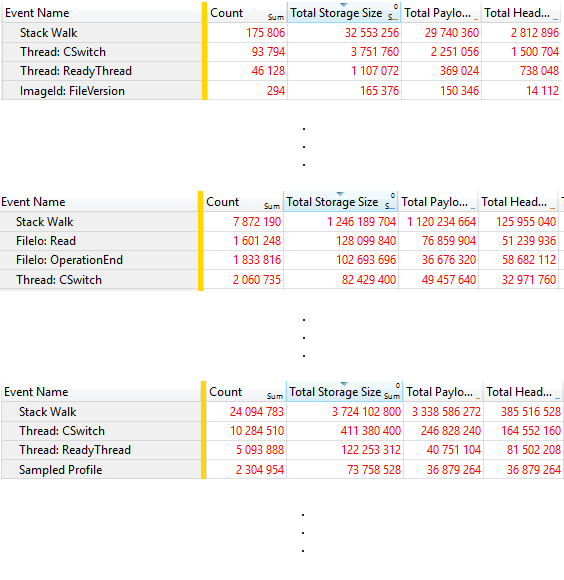
We can clearly see that in all three trace files it’s the stack walks that consume most data by a landslide. Now let’s see how LZNT1 performed (with compression ratios in parentheses; remember, the smaller, the better):
| Smallf | Medium | Largef | |
|---|---|---|---|
| Trace length | 6m 18s | 1m 48s | 30m 20s |
| Uncompressed trace size | 36.68 MB | 1.63 GB | 4.04 GB |
| Compressed trace size | 6.54 MB (17.83%) | 306.19 MB (18.34%) | 726.36 MB (17.56%) |
| Uncompressed stack walk data size | 31.04 MB | 1.16 GB | 3.46 GB |
| Compressed stack walk data size | 4.87 MB (15.69%) | 189.29 MB (15.94%) | 535.71 MB (15.12%) |
Much to my surprise, even though these three traces are quite different in virtually every aspect, the compression ratios came out to be consistent. Looks like LZNT1 provides about a 15% compression ratio for stack walks and about 17% in general. Not bad. Can we do better?
A low-effort attempt at manual ETL compression
We saw that in usual ETL files most space is taken up by stack walk data, so if we want to have smaller files, we should start looking there.
There are two simple ideas that came to my mind:
- Currently, x64 addresses are not 64, but 48-bit wide. The upper 16 bits are not used, but they must have the same value as bit 47 (this is called the canonical form).
- Stack traces recorded over time tend to be not that unique. The profiler interrupt will definitely catch hotspots with the very same call stack quite frequently. The same must be true for background threads unblocking and blocking repeatedly on the same thing when a context switch happens.
The first one is a no-brainer, actually: just store the lower 48 bits when saving the trace, then set bits 63 to 48 to the value of bit 47 when loading it. The second one is just a hunch so far, but we can check if it’s true quite easily. I threw together a small program that loads all stack traces from an ETL file, calculates a 64-bit hash from their content, and keeps track of the hash counts in a container. With this, we can get an idea about how unique stack traces really are in the three test files:
| Smallf | Medium | Largef | |
|---|---|---|---|
| Number of stack trace events | 175’806 | 7’872’190 | 24’094’783 |
| Number of unique hash values (~no. of stack trace kinds) | 6’487 | 294’291 | 517’148 |
| Average number of duplicates by kind | 27 | 26 | 46 |
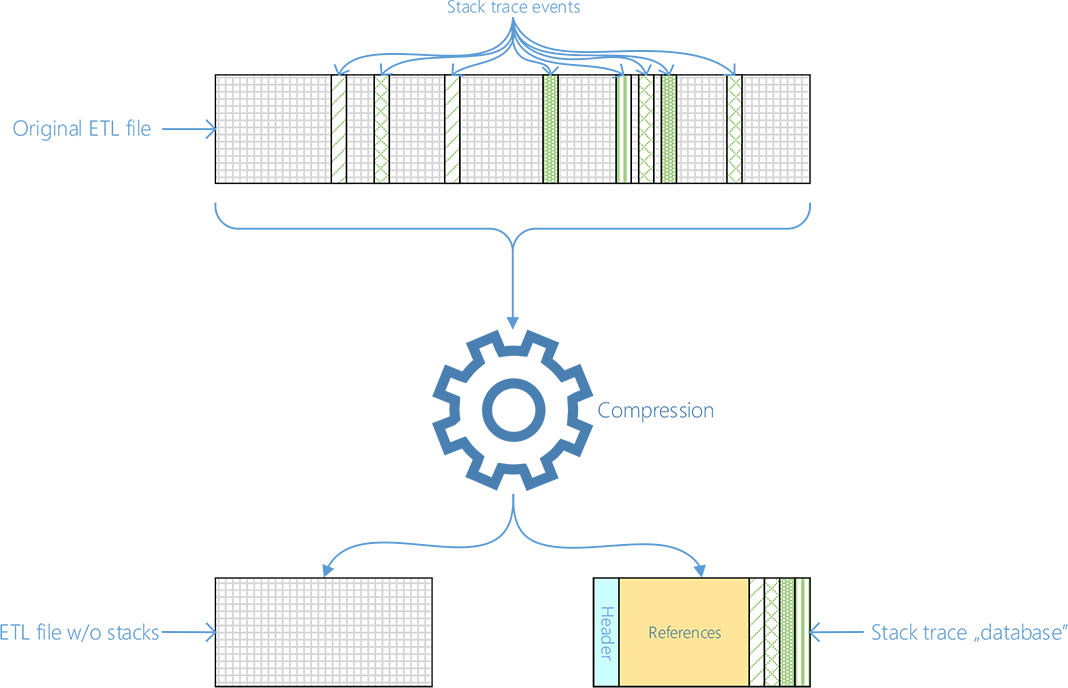
Indeed, there are a lot of duplicates in there. That’s good news because we can instance them (or deduplicate, if you will) in the following way:
- Iterate over all stack traces in the ETL file, calculate hash values for each one, and store their payloads
- Instead of including them directly in the ETL file, we store a reference (index) to the instanced data instead. We also have to store the PID and TID from the event, and the timestamp of course3.
- Serialize the data (references, and payload-hash combos) to a file
For the visual types out there (like me), here’s a figure:
And now we have a compressed trace. Keep in mind that my compression program performs the canonical address optimization mentioned above and deduplication in one step, so the results you will see is the effect of both. If you are easily overwhelmed by raw data, feel free to skip to the summary part (two tables below). First, let’s look at stack trace data sizes in isolation:
| Smallf | Medium | Largef | |
|---|---|---|---|
| Uncompressed stack walk data size | 31.04 MB | 1.16 GB | 3.46 GB |
| Built-in-compressed stack walk data size | 4.87 MB (15.69%) | 189.29 MB (15.94%) | 535.71 MB (15.12%) |
| Hand-rolled-compressed stack walk data (stackDB file) size w/o further compression | 6.49 MB (20.91%) | 269.99 MB (22.79%) | 777.17 MB (21.94%) |
| Hand-rolled-compressed stack walk data (stackDB file) size w/ ZIP4 compression | 1.27 MB (4.1%) | 53.08 MB (4.47%) | 169.29 MB (4.78%) |
With the hand-rolled compression we spared substantial amounts of data (around 80%), but we actually ended up being less efficient than the built-in algorithm. So the answer to the original question,
“Can we beat the built-in compression algorithm?”
is no (well, not in general, but with this simple technique presented in this post, of course). But that’s no problem because the real goal of this experiment was never really that, but to have even smaller ETL files. Fortunately, if we run a general compression algorithm on the hand-rolled-compressed result file, we get a 4-5% percent overall compression ratio, which is amazing.
It would be crucial to see how ZIP performs on the stack walk data alone in the original ETL file so we could make a direct comparison. What if ZIP alone would also provide compression ratios similar to this, so all this effort on manual compression is in vain?
Unfortunately, we can’t measure that, as there is no way of telling ETW to use a different compression algorithm. Of course, we could take the stack walk data out of the ETL file and serialize it into a sequential file, but that would change the physical layout, so the results would be skewed. We will have to see whether gains are worth all this trouble when we have the overall numbers on the whole traces.
Either way, I believe the great compression ratio of the hand-rolled compression combined with ZIP is because of two main reasons:
- General compression algorithms have limited context. In an ETL file, stack walk data is scattered around, so they are harder to compress. By creating a separate stack database file, not only did we remove lots of redundancy, but we also “accidentally” increased the locality of the remaining data, making general compression algorithms more efficient.
- Having data that is easy to compress is good, but having less of that data is even better.
So basically, we have less data and with good locality.
Now let’s look at the overall numbers (uncompressed vs. built-in compressed vs. hand-rolled-compressed ETL files, which consist of ETL files stripped of stack trace data, plus stack databases). I threw some well-known, general compression algorithms into the mix as well:
| Smallf | Medium | Largef | |
|---|---|---|---|
| Uncompressed ETL | 36.68 MB | 1.63 GB | 4.04 GB |
| ETL w/ built-in compression | 6.54 MB (17.83%) | 306.19 MB (18.34%) | 726.36 MB (17.56%) |
| ETL w/ ZIP4 compression | 2.28 MB (6.22%) | 183 MB (10.96%) | 437.33 MB (10.57%) |
| ETL w/ RAR compression | 2.22 MB (6.05%) | 103.64 MB (6.21%) | 275.66 MB (6.66%) |
| ETL w/ 7z (LZMA2) compression | 2.09 MB (5.69%) | 91.88 MB (5.5%) | 249.79 MB (6.04%) |
| Stripped ETL w/o compression + uncompressed stackDB | 11.99 MB (32.68%) | 756.11 MB (45.3%) | 1.33 GB (32.82%) |
| (Stripped ETL w/o compression + uncompressed stackDB) w/ ZIP4 compression | 2.5 MB (6.82%) | 129.36 MB (7.75%) | 301.63 MB (7.29%) |
| (Stripped ETL w/o compression + uncompressed stackDB) w/ RAR4 compression | 1.68 MB (4.59%) | 87.77 MB (5.26%) | 212.61 MB (5.14%) |
| (Stripped ETL w/o compression + uncompressed stackDB) w/ 7z (LZMA2) compression | 1.83 MB (4.98%) | 82.1 MB (4.92%) | 221.22 MB (5.35%) |
I highlighted the best overall compression ratios. I suggest you take a moment to compare the results. Here are my observations:
- Built-in compression is better than nothing, but there is an obvious room for improvement
- Simply compressing the original (uncompressed) ETL files with a general algorithm already provides a huge advantage
- Doing that on a manually compressed ETL file offers even better compression ratios, but the difference is marginal (1-2%), unfortunately
Given that using the built-in compression has the advantage of not requiring any 3rd party tools, we can draw the following conclusions:
- If you are satisfied by the compression ratios offered by the built-in compression infrastructure, you are fine
- If you are not, you should compress your ETL traces with a general compression algorithm. However, if you want to use a tool (like WPA) to operate on it, you need to decompress it first, which takes some time and is tedious to do on every occasion
- If you need even better compression ratios, you could achieve that with techniques similar to what is mentioned in this blog post, but the additional savings in size is so marginal that it’s not worth the hassle
Closing thoughts, source code
The source code of the program that was used in this blog post is available for download. Be aware, however, that this was just an experiment, so the code quality is utter garbage, and it’s probably full of bugs and memory leaks. If you are okay with that, here’s the download link (you have been warned!).
Other than the points outlined above, there are two additional reasons why my compression program is impractical:
- The compression speed is horrible
- Compressing and then decompressing a trace does not yield the exact same result
The public API that is provided for accessing/manipulating the content of ETL files is very limited and sequential. Even though there is a lot of room for performance optimizations in my program, sequential access is a limiting factor for analysis/compression/decompression speed that can’t be worked around.
Even though the differences are almost negligible, I did not feel good about this (after all, it’s either correct or not; no in between).
I’m sure a faster, more efficient, and 100% correct compression method could be implemented, but I don’t want to invest any more time into this experiment. The whole story started out as a quick investigation, but eventually, I ended up putting much more time into this than I wanted to originally.
1 xperf will compress your traces during merge time (after the “original” trace has been collected), so in that use case speed is not of paramount importance. Compression speed becomes much more relevant if data needs to be compressed real-time. A new flag for the public ETW API called EVENT_TRACE_COMPRESSED_MODE was introduced in the Windows 10 Anniversary Update (note that this does not necessarily mean that this functionality wasn’t implemented in earlier versions; ETW does have a private – and thus undocumented – API that for instance, xperf uses). I don’t know if this uses the same compression infrastructure that xperf and WPA do, but if that’s the case, that would explain the use of a “fast-but-not-so-efficient” compression algorithm.
2 How I achieved that is not important for this blog post. It’s far from trivial anyways, but I plan to write about it in the future.
3 If you are familiar with ETW, you might know that generally there is more metadata associated with an event than just a bare timestamp (in the EVENT_HEADER and EVENT_RECORD structures). That’s true, but in the case of stack trace events, every field is either zero, or has the default value set, except for BufferContext.
4 WinRAR defaults. I couldn’t find which algorithm is used in case of ZIP compression (DEFLATE, gzip, etc.)

The EVENT_TRACE_COMPRESSED_MODE functionality was indeed “implemented in earlier versions”. User-mode loggers have it in Windows 8 and higher. It wasn’t even defined in EVNTRACE.H until the 1607 edition of Windows 10 (the Anniversary edition, as you note). Sadly, this is just one example of how Microsoft is not nearly as open about ETW as might be thought or wished. As amazing as ETW is, and useful too, I for one have mixed feelings about complimenting Microsoft for it while so much of the functionality and utility is plainly kept by Microsoft as a private pleasure.
LikeLike
I definitely agree. I would even go so far as to say that Microsoft is missing a huge opportunity by not exploiting the potential in ETW enough. I mean both the API level, and GUI tools like WPA. I have an open source profiler based on ETW (https://github.com/Donpedro13/etwprof), and it took me several days to figure out even some basic things by experimentation and looking at assembly code, because documentation was either poor or nonexistent. WPA also lacks proper training materials and some key customization features, like plug-ins (the “Generic Events” view and “Regions of Interest” isn’t much to work with, to be honest…).
I’m optimistic about its future though, and hope that Microsoft will take a similar path here to windbg (that is, realizing that it’s not used only in exotic scenarios, and giving it a proper investment).
P.S. your site is really useful, I used it a couple of times in the past as a reference.
LikeLike
By the way, I should add something practical. A side-effect of under-documentation is that it’s not easily realised just what the built-in compression compresses. It compresses trace buffers, one by one (leaving the WMI_BUFFER_HEADER at the start as uncompressed).
As you know, a tracing session has fixed-size trace buffers that events accumulate in and then as each trace buffer fills (or ages, or whatever) it gets flushed to the ETL file. Compressed mode inserts an extra step. As successive trace buffers get flushed, they don’t go directly to the file but are instead compressed into a holding buffer. When this buffer accumulates a trace buffer’s worth of compressed data, i.e., compressed from potentially many uncompressed trace buffers, this much compressed data is flushed to the ETL file.
What this tells you is that the compression algorithm is never fed more than one trace buffer at a time. If your tracing session is run with the default 4KB buffer size, then the compression algorithm likely will find useful savings from repetitions in each 4KB, but it isn’t really let loose on finding repetitions that are spread more widely. You can expect a better compression ratio with a bigger size of trace buffer, though that comes with its own trade-offs.
Well, that’s this theoretician’s take on how you’d get the built-in compression to perform better. I for one would be interested to see what shows up in experiments – though I’m curiously enough not interested enough that I’d do the experiments myself!
LikeLike
“I’m sure a faster, more efficient, and 100% correct compression method could be implemented, but I don’t want to invest any more time into this experiment.”
Good news! Someone at Microsoft already did that for you! (They did not, of course, publicly document it…) And you even get free support in tools like WPA with it!
Enabling it in C# might look something like this:
NtSetSystemInformation(SYSTEM_INFORMATION_CLASS.SystemPerformanceTraceInformation, &new EVENT_TRACE_STACK_CACHING_INFORMATION
{
EventTraceInformationClass = EVENT_TRACE_INFORMATION_CLASS.EventTraceStackCachingInformation,
TraceHandle = traceHandle,
Enabled = true
}, sizeof (EVENT_TRACE_STACK_CACHING_INFORMATION));
struct EVENT_TRACE_STACK_CACHING_INFORMATION
{
public EVENT_TRACE_INFORMATION_CLASS EventTraceInformationClass;
public ulong TraceHandle;
public bool Enabled;
public byte Reserved1;
public byte Reserved2;
public byte Reserved3;
public int CacheSize;
public int BucketCount;
}
LikeLike
Thanks for the heads up. Looks like this has been available for years now (how did I miss it? 🤔). Does xperf use this by default? I’m not seeing any significant differences in the size of my traces with xperf vs. what I get with e.g. a relogged trace with compression turned on (https://docs.microsoft.com/en-us/windows/desktop/api/relogger/nf-relogger-itracerelogger-setcompressionmode) or with a merged trace with EVENT_TRACE_MERGE_EXTENDED_DATA_COMPRESS_TRACE.
Do you have any direct experience using this functionality, and if so, how much impact does this have on trace sizes?
P.S. you seem to have a decent knowledge of internals (like https://github.com/Zhentar/Wpa.Demystifier). Do you happen to work for Microsoft?
LikeLike
Ha, no I don’t work for Microsoft ([salt]you can tell because I try to tell people about ETW features[/salt]), I’m just inclined to take ‘it’s undocumented’ as a challenge rather than a road block 😁. In this case, I learned of the feature’s existence from PerfView/TraceEvent (which has an option for turning it on).
You can tell when it’s in use from the Trace Statistics – in addition to showing “Stack Walk” you’ll see entries like “Stack Walk: Reference [User]” and “Stack Walk: Rundown Definition”. I don’t think xperf applies it, but I don’t use xperf directly much these days (.NET rundown is too much of a hassle with it). I see a ~50% reduction in pre-merge compression stackwalk size (my application probably needs a larger cache size than the default, I should test that some time). Post merge compression isn’t significantly different, might even be a bit larger – but I’m more worried about intermediate files running out of disk space during long traces on VMs with tight provisioning than I am the final file size, so I haven’t examined that part much.
LikeLiked by 1 person
Interesting. Could you point me to the relevant code in the public PerfView GitHub repository? I tried searching for some keywords with no success.
LikeLike
PerfView turns it on using a separate DLL that is not open source; you have to decompile OSExtensions.dll to see what makes it tick. And unfortunately it just uses the default tuning parameters, so I had to peek around inside ntoskrnl to learn how they worked. I’ve written up the details here: https://gist.github.com/Zhentar/7f3f60fb51e89fe95abca7b9724964ba
I haven’t actually put all of the details in there to the test yet. I’ll be running some experiments next week & will update the gist if uncover any inaccuracies.
LikeLike
Thanks, that’s a pretty useful write-up. I will try to make use of this feature in my profiler.
LikeLike
Did you try the stack compression feature? What are your experiences with it? Since compression needs CPU I would expect some more perf overhead. When CPU Sampling is enabled I see ca. 5-10% speed decrease whereas with Context Switch /Disk/FileIO tracing I see ca. 30% overhead. I also wonder if xperf or tracelog support this flag as well. At a first glance I could not find it.
LikeLike
I did try it, not in the context of this blog post, though: https://github.com/Donpedro13/etwprof/issues/9
I haven’t measured CPU overhead, only trace sizes.
LikeLike
I’ve never tried to explicitly measure the overhead of stack caching, but it seems to be fairly insignificant. It’s a hashed lookup of recently used callstacks with a hard limit (4) on collision chaining, so it’s not very compute intensive though it will add some cache pressure.
But regardless, I’ve had to stop using it, because neither WPA or PerfView can correctly handle an address mapping to more than one symbol across references (such as when a JIT compiler reuses a buffer for a different function)
LikeLike
Ahh thats interesting! WPR seems to produce traces with time inversions in ESXI VMs by default which is kind of annyoing. While when I record data with xperf things just work. I wonder which arcane APIs WPR is using to get things messed up. Not to mention that wpr bug that prevents to stop a trace due to some COM error. https://devblogs.microsoft.com/performance-diagnostics/wpr-start-and-stop-commands/ Looks like xperf is still the best tool.
LikeLike
I definitely wouldn’t go so far as to say that xperf is the best – it’s more or less limited to just the Win 7 ETW features. WPR gets all the new Windows 8+ additions (off the top of my head, using non-default kernel loggers, combined user + kernel sessions, hardware counters, stack caching; and I don’t remember if it’s a Win 8 feature but there’s also enabling/disabling stacks for specific keywords and event IDs). Though I’m also not a big fan of WPR – I mostly just use a custom utility based on TraceEvent.
LikeLike
No xperf is not best but combined with tracelog it gets the job done. xperf is good to start the ETW session, tracelog to set addtional filter options and xperf to stop profiling again to do the correct NGen rundown where wpr frequently fails on machines where many (30+) processes with no NGenned code live. So far I did not find a way to customize the NGen rundown with WPR. The rundown time and or buffer size is way too small for these scenarios. I ended up with a 512 MB or even 1 GB large CLR Rundown buffer size to capture the JITed method indices to get usuable callstacks.
LikeLike
Certainly, poor buffer sizing (made much worse by both the fervor for enabling high volume events and the lack of de-dupe for state capture across multiple profiles) is one of my bigger complaints with WPR. But nearly everything WPR does is customizable, if you can stomach figuring out the XML profile format (extracting the XSD & default profiles from the DLL resources helps a bit).
It’s always interesting hearing others’ experiences with ETW, though – my utility does CLR rundown with 128MB buffers (instead of TraceEvent’s default 64) ‘just in case’, because why not; it’s never been insufficient for me. And I’ve seen plenty of WPR recordings from ESXi guests without ever encountering a time inversion from it. I wish there were more of us talking about our experiences to aggregate knowledge from…
LikeLike